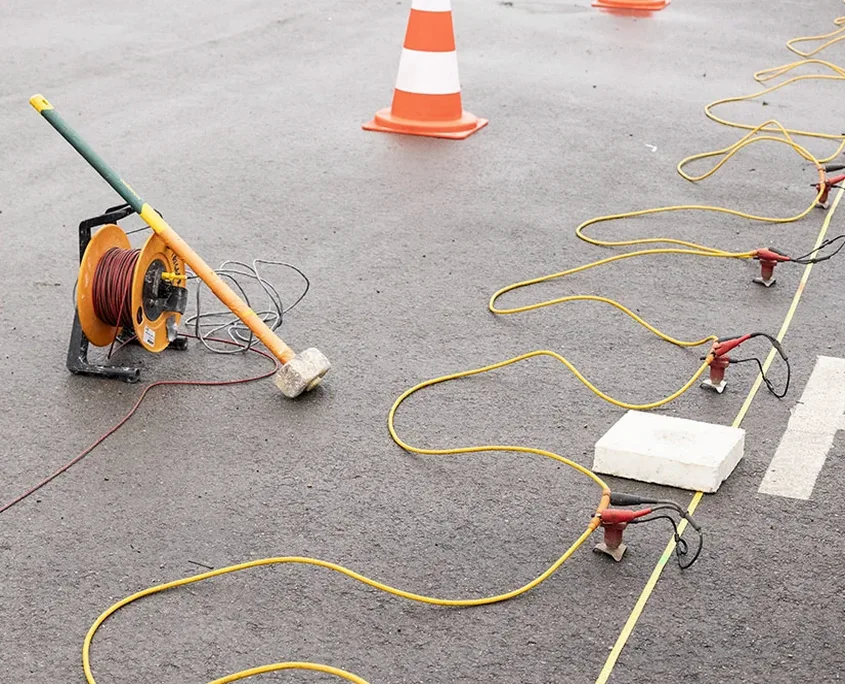
A 24-channel wireless seismograph array is deployed across the site, geophones planted at 5-meter spacing along a cleared survey line. The accelerated weight drop source strikes the ground plate at each shot point while the recording unit stacks the signals in real time. Barrie's glacial terrain, with its alternating layers of sand, silt, and clay overlying the Paleozoic limestone bedrock, produces distinct seismic velocity contrasts that we capture through both P-wave refraction and SH-wave reflection acquisition. The raw field records show clear first arrivals and identifiable reflectors down to 30 meters depth, which is critical because the seismic refraction method alone sometimes misses low-velocity zones hidden beneath faster layers—a common scenario in the Kempenfelt Bay lacustrine deposits. Our processing workflow applies tomographic inversion with curved-ray tracing rather than straight-ray assumptions, resolving lateral velocity gradients that conventional delay-time methods flatten out. For sites near the waterfront where the overburden exceeds 20 meters, we often combine this with MASW profiling to constrain the Vs30 value required by the NBCC site classification system.
Seismic velocity contrasts in Barrie's glacial terrain can shift from 400 m/s in loose fill to over 2,000 m/s in dense till within a single 48-meter spread.
Process and scope
Site-specific factors
The south-end subdivisions near Big Bay Point sit on a thick sequence of glaciolacustrine clay with shear-wave velocities below 180 m/s, placing them squarely in NBCC Site Class D or E depending on depth to bedrock. Cross town to the north near the Georgian College area, the till is shallow and compact, with velocities exceeding 360 m/s and a Site Class C designation. The seismic design forces differ by nearly a factor of two between these locations. A refraction survey run across a 100-meter transect in the south end will typically show a low-velocity layer from 2 to 8 meters depth that a borehole log alone might describe simply as 'clay'—but the tomogram reveals whether that clay is homogeneous or riddled with sand lenses that alter the site period. Missing this distinction leads to overconservative foundation design or, worse, underestimating the spectral acceleration at the structure's fundamental period. For critical facilities, the reflection data can also image the bedrock surface topography, flagging abrupt steps or depressions where differential settlement becomes a concern during post-earthquake reconsolidation.
Regulatory framework
ASTM D5777-18: Standard Guide for Using the Seismic Refraction Method, NBCC 2020 Division B, Part 4: Seismic Site Classification via Vs30, CSA A23.3-19: Seismic design provisions referencing site class input
Related services
P-Wave Refraction Tomography
Primary method for mapping bedrock depth, rippability, and lateral velocity variations across a site. We acquire data along multiple overlapping spreads and invert with curved-ray algorithms to produce 2D velocity cross-sections with cell resolution down to 0.5 meters.
SH-Wave Reflection Profiling
Deploy horizontal geophones and a shear-wave source to image stratigraphic layering within the overburden. Effective where the water table masks P-wave reflections. Delivers high-resolution sections of sand, silt, and clay interfaces down to 60 meters.
Vs30 Site Classification Surveys
Combined refraction and surface-wave acquisition to determine the time-averaged shear-wave velocity in the upper 30 meters. We provide the Vs30 value, NBCC Site Class letter, and the corresponding short-period and 1-second spectral acceleration coefficients for structural design input.
Bedrock Rippability Assessment
Using the seismic velocity cross-section calibrated to published rippability charts (Caterpillar and Komatsu datasets), we delineate zones where the limestone bedrock can be excavated by mechanical ripper versus zones requiring hammer or blasting.
Typical parameters
Frequently asked questions
How deep can seismic refraction see in Barrie's soil conditions?
The depth of penetration depends on the spread length and the velocity structure. With a 120-meter spread, we typically image to 25–35 meters depth in Barrie's glacial sediments, reaching the top of the limestone bedrock in most parts of the city. Where bedrock lies deeper than 40 meters, the refraction method loses resolution and we recommend supplementing with reflection profiling or downhole seismic testing.
What surface access is needed to run a survey line?
We need a reasonably clear strip about 2 meters wide along the entire transect length. Grass, gravel, asphalt, and compacted soil all work fine as long as the geophones can achieve good ground coupling. Dense bush, standing water, or deep snow will degrade data quality. The weight drop source requires no hammering or drilling, so noise and vibration are minimal compared to other geophysical methods.
Can you survey in winter when the ground is frozen?
Yes, but with caveats. Frozen ground increases near-surface seismic velocities significantly, which can mask the true velocity of the unfrozen soil. We apply a frost correction factor based on local Barrie winter ground-temperature data to adjust the tomogram. Ideally, we schedule surveys between April and November, but winter work is feasible for urgent projects if the client accepts the added uncertainty in the uppermost 1 to 2 meters.
How much does a seismic tomography survey cost in Barrie?
For a typical site investigation in Barrie involving two to three refraction lines totaling 200 to 300 linear meters with tomographic processing, the cost ranges from CA$3,340 to CA$8,210. The final figure depends on line length, number of spreads, surface conditions, and whether reflection acquisition is included. We provide a fixed-price quote after reviewing the site plan and investigation objectives.
What deliverables do we receive after the survey?
The standard report package includes: 2D P-wave velocity tomograms with annotated bedrock surface, processed shot gathers showing first-arrival picks, a Vs30 calculation and NBCC site class determination, a rippability assessment if bedrock is encountered, and a written interpretation discussing anomalies, limitations, and recommendations for targeted borehole locations. All figures are provided in PDF and CAD-compatible formats.